EXPLORATORY DATA ANALYSIS AND PREDICTIVE MODEL BUILDING FOR A BANK'S MARKETING ACTIVITY


INTRO
The data revolves around the outcomes of direct marketing campaigns conducted by a prominent Canadian banking institution, with a primary focus on phone-based interactions. The essence of these campaigns lies in their objective to determine the subscription likelihood of a bank term deposit. Notably, the communication strategy involved multiple contacts with the same client, emphasizing the importance of repeated engagements to ascertain whether the client would subscribe ('yes') or decline ('no') to the offered product. This analysis explores the details of the bank's marketing efforts and tries to understand what influences customers in deciding whether to get a term deposit or not.
DATA PREP


-
I worked with a dataset containing information about consumers, aiming to predict whether they would opt for a term deposit.
-
The dataset consisted of 41,000 rows and various columns, covering details like age, job, marital status, education, loan status, default status (indicating if the client has credit in default), and more.
-
Although the data was quite structured, it did contain numerous missing values.
-
This was dealt with by using the mode value for columns such as job, marital status, loan status, default status since the number of missing values were less than 2% of the dataset. For columns such as housing and education which had 4% and 7% missing values respectively, I implemented a KNN (K-Nearest Neighbor) imputation strategy.
-
Additionally I also performed data type conversion for specific columns in the dataframe to more memory efficient types such as 'uint8' and 'uint16' as well as introduced a categorical representation of age for further analysis or visualization purposes.
ANALYSIS


-
Graph 1: Term Deposit Subscriptions by Month:
-
Clients exhibit a noticeable trend of subscribing to term deposits in higher numbers during specific months, particularly in December, March, October, and September.
-
This could be due to the fact that certain months may coincide with financial planning periods, tax seasons, or other factors influencing subscription decisions.
-
-
Graph 2: Optimal Days for Phone Calls:
-
No distinct pattern or "best" days for making phone calls to clients is discernible from the data.
-
This could be due individual preferences that clients would have and their availability and receptiveness to calls may vary widely, making it challenging to identify specific days as universally optimal.
-
-
Graph 3: Term Deposit Subscriptions by Occupation:
-
Retired workers and students emerge as demographic groups with higher probabilities of subscribing to term deposits.
-
This suggests that individuals in these occupational categories are more likely to show interest in the offered banking product.
-
Financial stability can be cited as the reason for this. Retired individuals may have more disposable income, while students may be planning for future financial stability, increasing their likelihood of subscribing.
-
-
Graph 4: Age Groups and Term Deposit Subscriptions:
-
Individuals in the "17-25" and "65 above" age groups demonstrate similar tendencies regarding term deposit subscriptions, as observed in retired workers and students.
-
Both younger individuals and those in retirement are at diverse life stages and may prioritize long-term financial planning, leading to comparable subscription behavior.
-
-
Graph 5: Marital Status Impact on Subscriptions:
-
Marital status appears to have a minimal impact on the likelihood of subscribing to term deposits.
-
Marital status alone may not be a decisive factor, as individual financial objectives can differ regardless of marital status.
-
-
Graph 6: Educational Impact on Subscriptions:
-
Clients with varying levels of education exhibit similar subscription patterns, indicating that education does not significantly affect their decision.
-
-
Graph 7 - Communication Mode Efficiency:
-
The "cellular" communication mode stands out as more efficient for contacting clients regarding term deposits.
-
Clients may be more responsive to communication via mobile phones, which are often more readily accessible than other communication channels.
-
-
Graph 8 - Previous Default Impact:
-
Clients with no previous default history demonstrate slightly higher chances of subscribing to term deposits.
-
Clients without a history of default may be perceived as more creditworthy, positively influencing their chances of subscribing.
-
-
Upon deeper examination, it becomes evident that the majority of customers are distributed within the age range of 17 to 69.
-
Additionally, the analysis reveals that the duration of phone calls for a significant portion of clients typically falls within the range of 0 to 644 seconds.

-
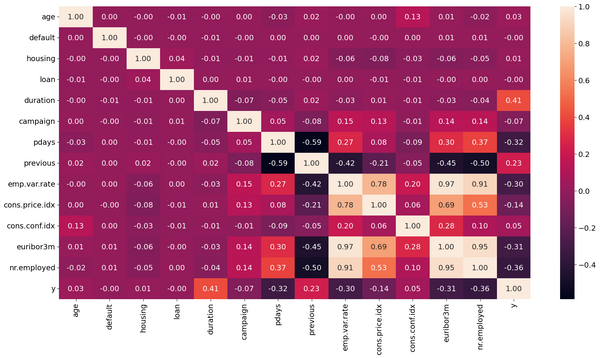
Utilizing a heatmap, a correlation coefficient of 0.41 is observed between the variables "Duration" and "y" (subscription to a term deposit).
-
A correlation of 0.41 is considered quite strong in a social science context, indicating a meaningful relationship between the two variables.
-
A positive correlation of 0.41 suggests that there is a tendency for a longer duration of phone calls to be associated with an increased likelihood of customers showing interest in subscribing to a term deposit.
-
Another notable correlation is observed between the variables related to previous contacts and subscription probability, yielding a coefficient of 0.23.
-
This correlation of 0.23 suggests that customers who have been contacted previously are more inclined to subscribe to a term deposit.
-
For marketing strategies, the insight derived from the correlation analysis implies that investing time in longer, meaningful conversations with clients may enhance the chances of successfully promoting term deposits.
-
Furthermore, targeting customers who have had prior interactions could be a strategic approach to improve subscription rates.
PREDICTIVE MODEL BUILDING
-
In this analysis, I evaluated the predictive performance of four different models—Logistic Regression, K Nearest Neighbors, Support Vector Machines (SVM), and Decision Tree Classifiers—trained on a dataset consisting of customer information to predict subscription outcomes for a bank term deposit following marketing phone calls. The binary classification task involves identifying whether a customer subscribes (denoted as 1) or does not subscribe (denoted as 0) to the term deposit.
-
Each model's performance was assessed through key metrics such as accuracy, precision, recall, and F1-score, offering a clear understanding of their strengths and limitations. The following summary provides detailed insights into how each model performs in predicting customer subscription behavior, helping us understand their relative effectiveness in this marketing context.
Logistic Regression
-
The logistic regression model achieved a high overall accuracy of 91%.
-
The model exhibited strong performance in correctly identifying customers who did not subscribe (class 0) with high precision of 0.93 and recall of 0.97.
-
However, for customers who did subscribe (class 1), the model's precision of 0.64 and recall of 0.41 are relatively lower.
-
The F1-scores provide a balanced measure, taking into account the trade-off between precision and recall for both classes.

K Nearest Neighbor

-
An R2 score of 0.38 indicates that the KNN model explains approximately 38% of the variance in the target variable. This means that the model captures a significant portion of the variability in the data.
-
With a MAE of 0.11, on average, the KNN model's predictions deviate by 0.11 from the actual values. A lower MAE suggests that the model's predictions are, on average, close to the true values.
-
A MSE of 0.06 implies that, on average, the squared differences between predicted and actual values are small. This suggests that the model's predictions are generally close to the true values.
-
With an RMSE of 0.24, the KNN model's predictions have a small average deviation from the actual values, indicating good overall performance.
-
The KNN model demonstrated a reasonable ability to capture the underlying patterns in the data, as evidenced by the positive R2 score.
-
The low MAE, MSE, and RMSE also suggest that the model's predictions are generally close to the actual values, indicating a good fit.
Support Vector Machines
-
The SVM model achieves a high accuracy of 90%, indicating good overall predictive performance.
-
It performs well in correctly identifying instances of class 0 (not subscribing), as evidenced by high precision and recall.
-
However, the model faces challenges in identifying instances of class 1 (subscribing), as reflected in lower precision and recall for this class.
-
The F1-score for class 0 is 0.95, indicating a balance between precision and recall. For class 1, the F1-score is 0.31, suggesting a trade-off between precision and recall.

Decision Tree Classifier

-
The Decision Tree Classifier model achieved a competitive performance with an accuracy of 89%.
-
With an NMAE of 0.11, the Decision Tree model's predictions have a relatively small average deviation from the actual values, considering the range of the target variable.
-
A MSE of 0.11 implies that, on average, the squared differences between predicted and actual values are relatively small. This suggests that the model's predictions are generally close to the true values.
-
With an RMSE of 0.33, the Decision Tree model's predictions have a moderate average deviation from the actual values, considering the range of the target variable.